MAPPING EMOTIONS
Developed in partnership with Sunderland Business Improvement District (BID), the project combines community data mapping activities with creative design and visualisation in order to explore and novel ways to collect, visualise, and share the experiences of individuals and communities within and around the Sunderland BID.
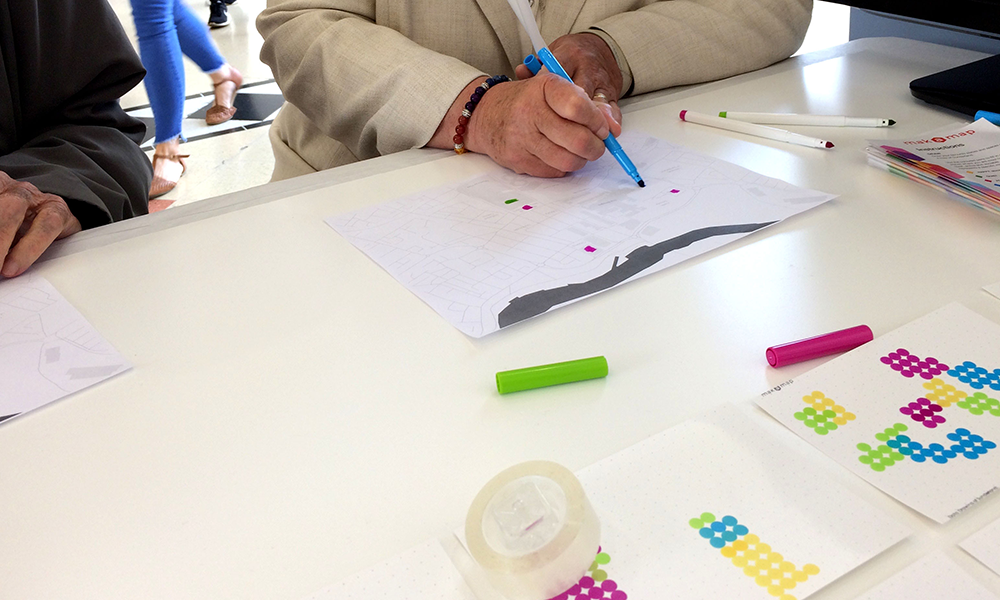
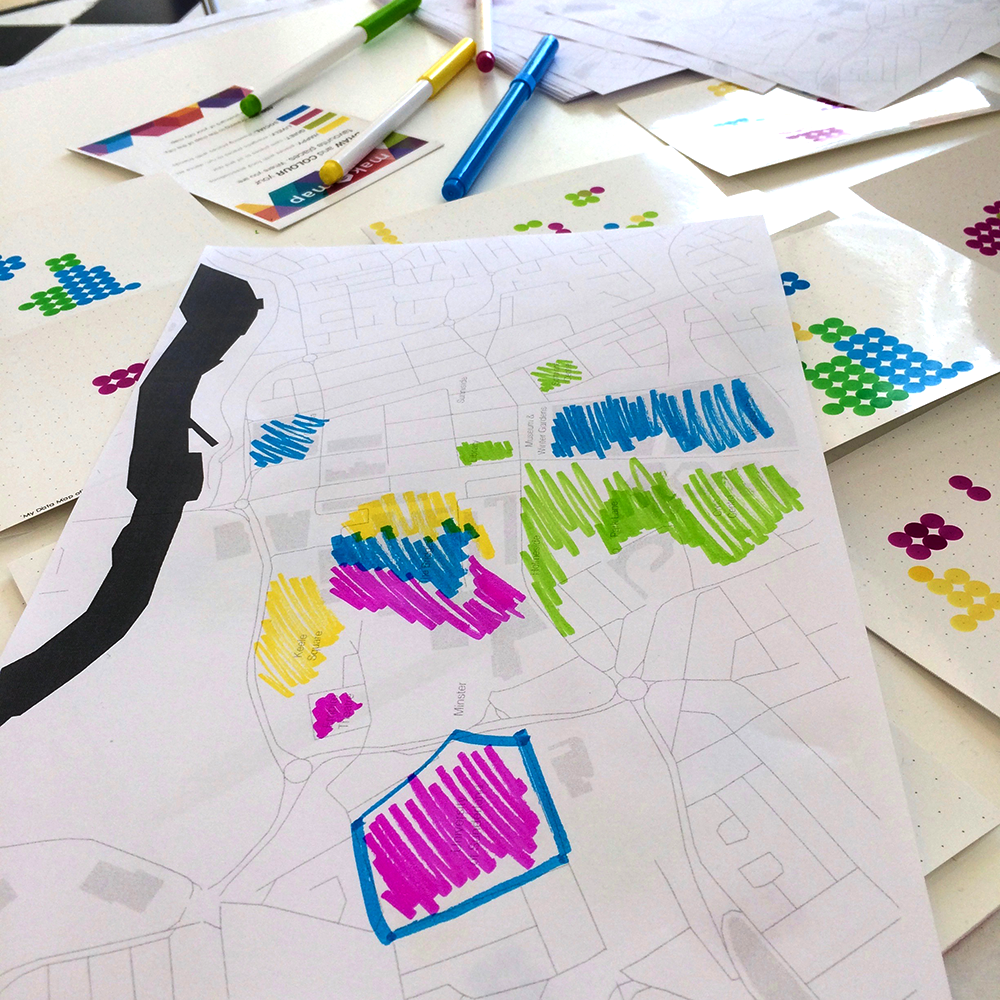
Paper-based drawings and mapping activities were conducted in city centre for people to record users emotions and moods in and around the BID area. Participants were given paper maps of the district, and asked to record, with coloured markers, their emotions associated specific areas and locations. Each colour was representative of a specific mood (happy, sad, social, quiet). The resultant paper maps were used as the base data set used for visualisation.
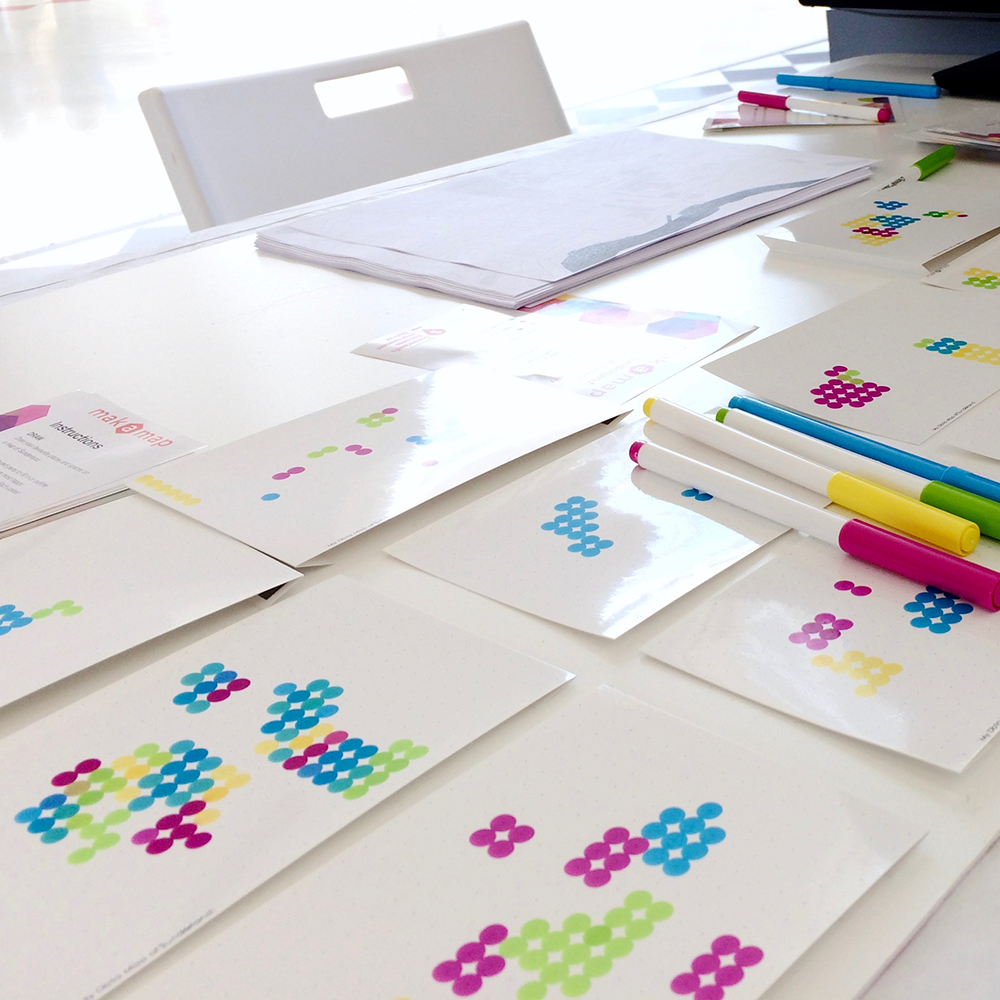
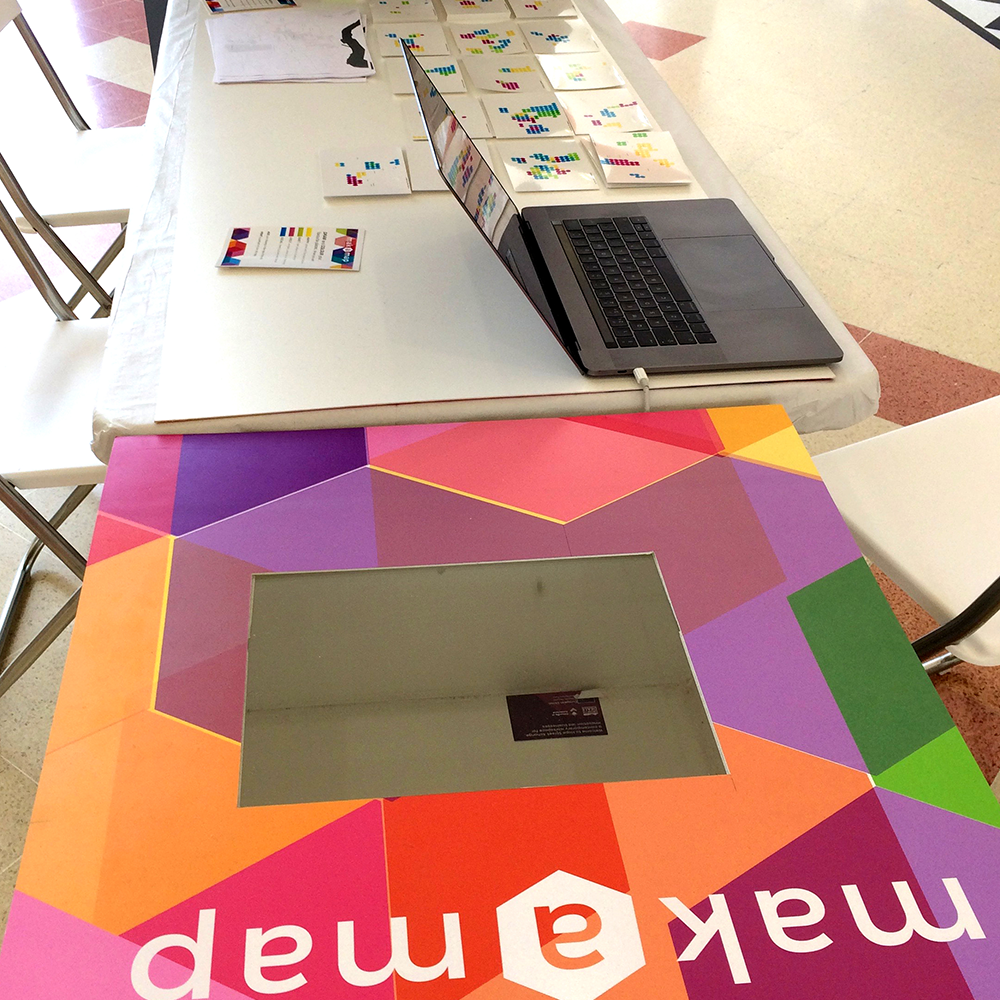
Postcards
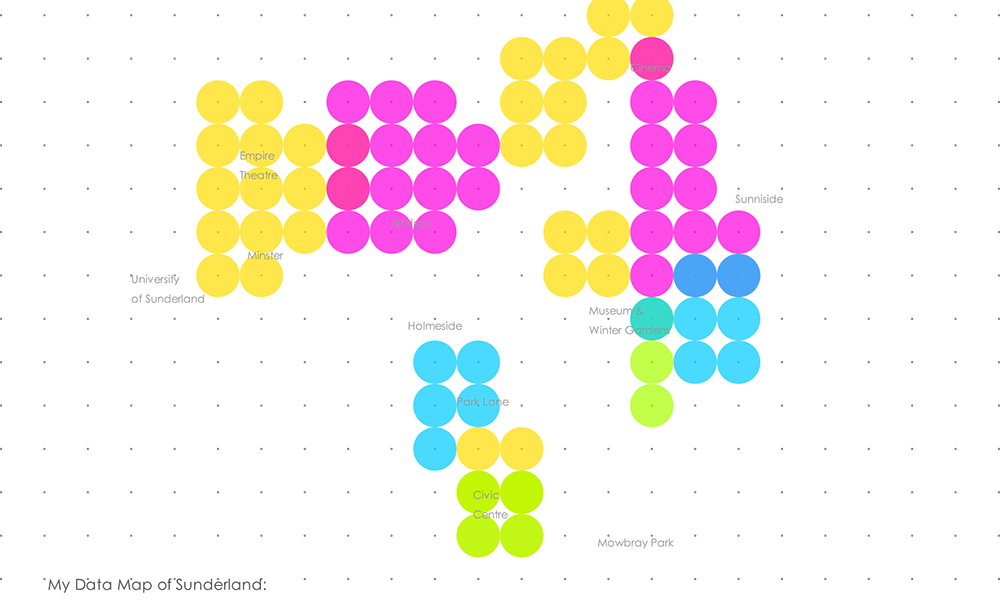
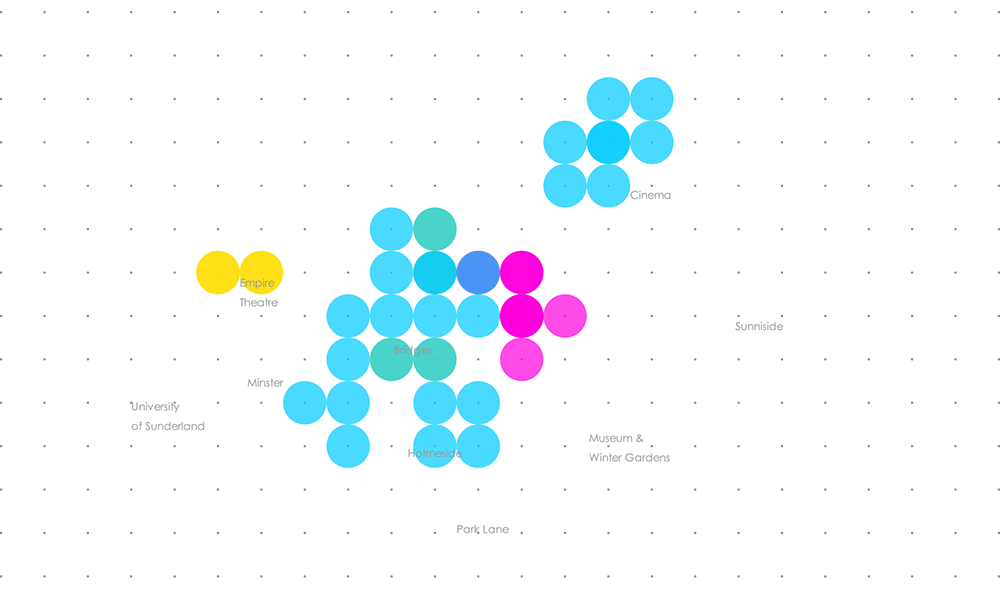
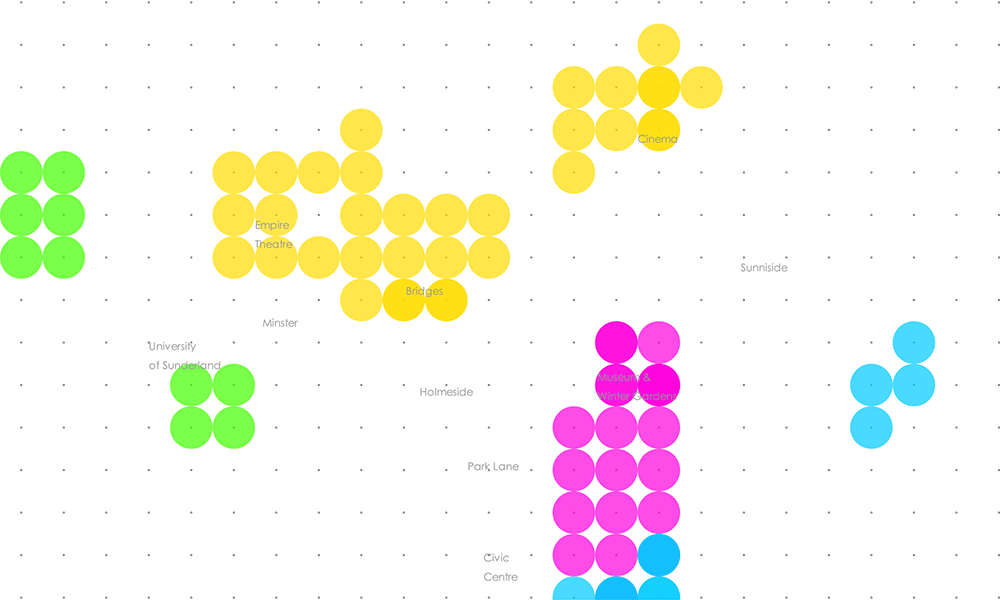
The source data - the coloured paper maps - were digitised using a specially created computer vision application. The shaded areas of colour from the drawings were dynamically mapped as digital shapes and aggregated into single digital data set, which was used to create an 'emotional visualisation map of the city.
Using this process the hand-drawn maps were translated into a series of unique data-postcards of the city mapping the 'emotional spots' and locations.

Interface
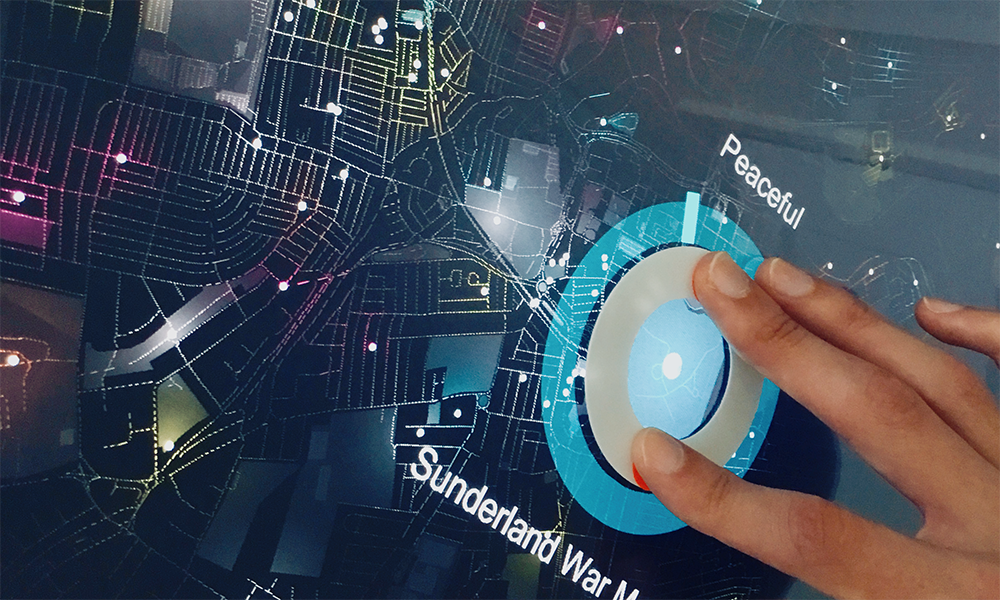
The data was also used to generate a live, dynamically updated interactive digital interface which was generated live from each user map.
This visualised all the data gathered from each drawing into a single digital interface. This allowed users to see a live and dynamically updated emotional map of the city which revealed clusters of emotional 'hot spots' is location around the BID.
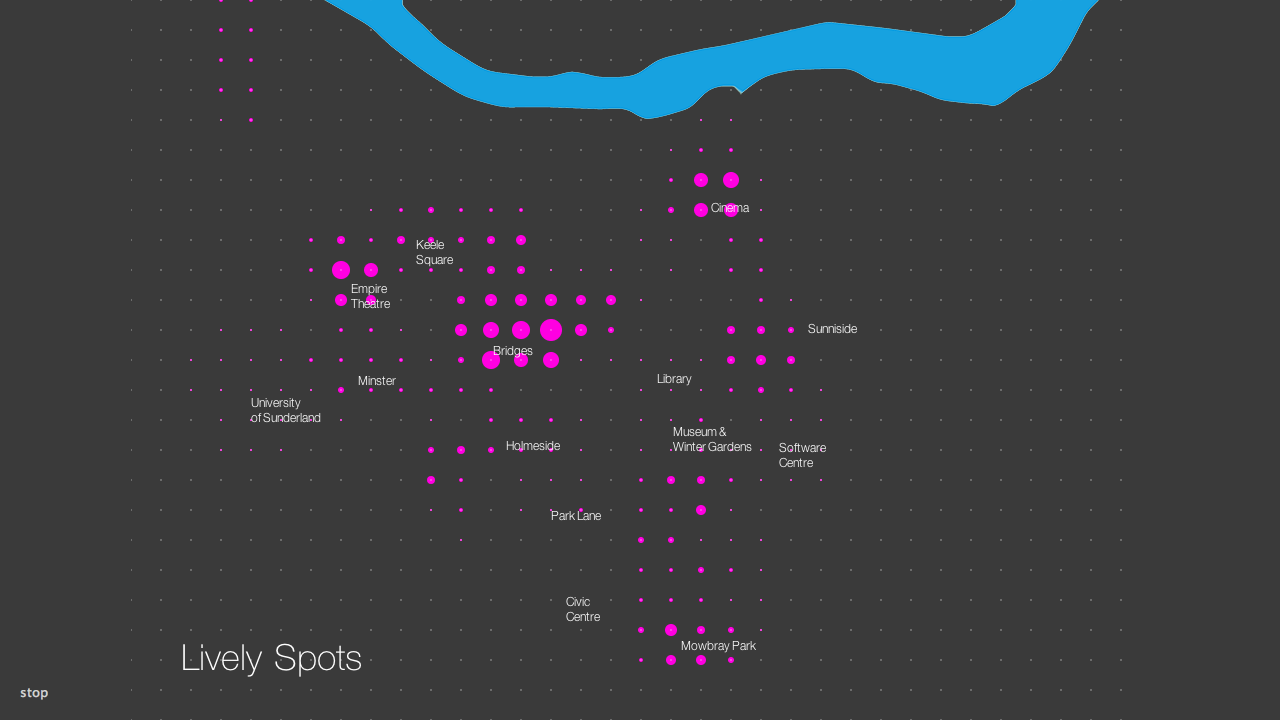
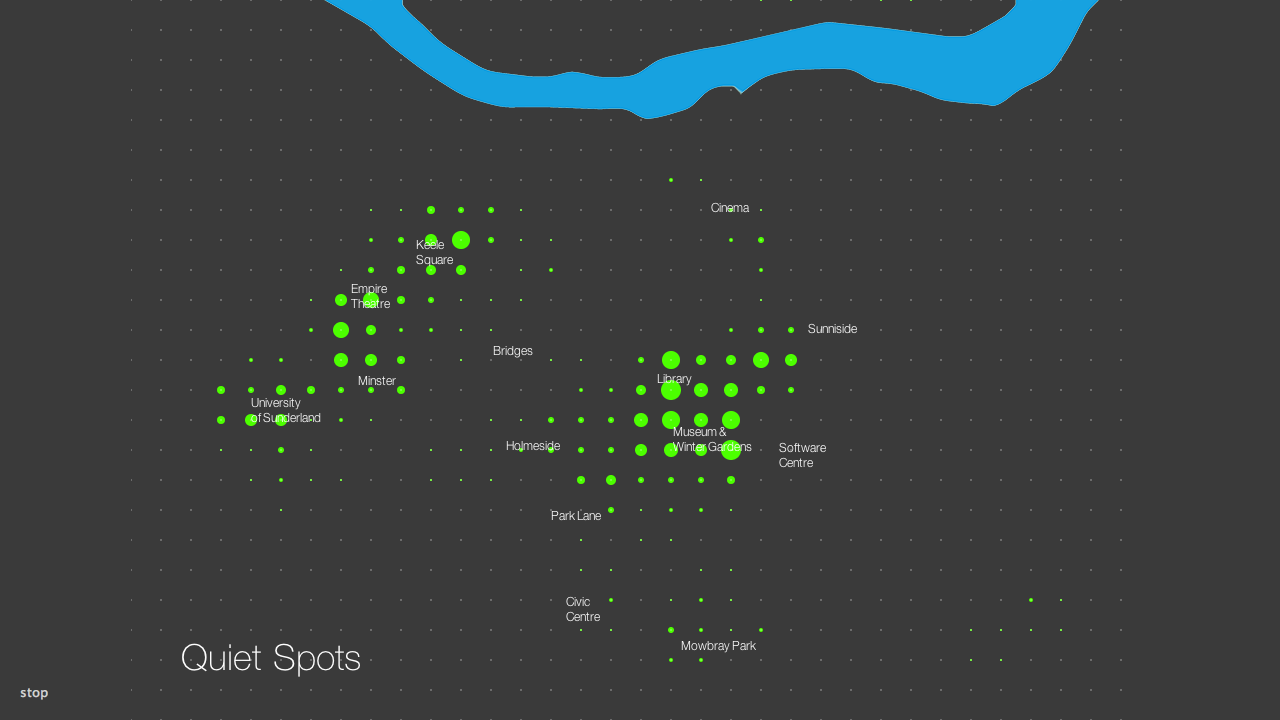
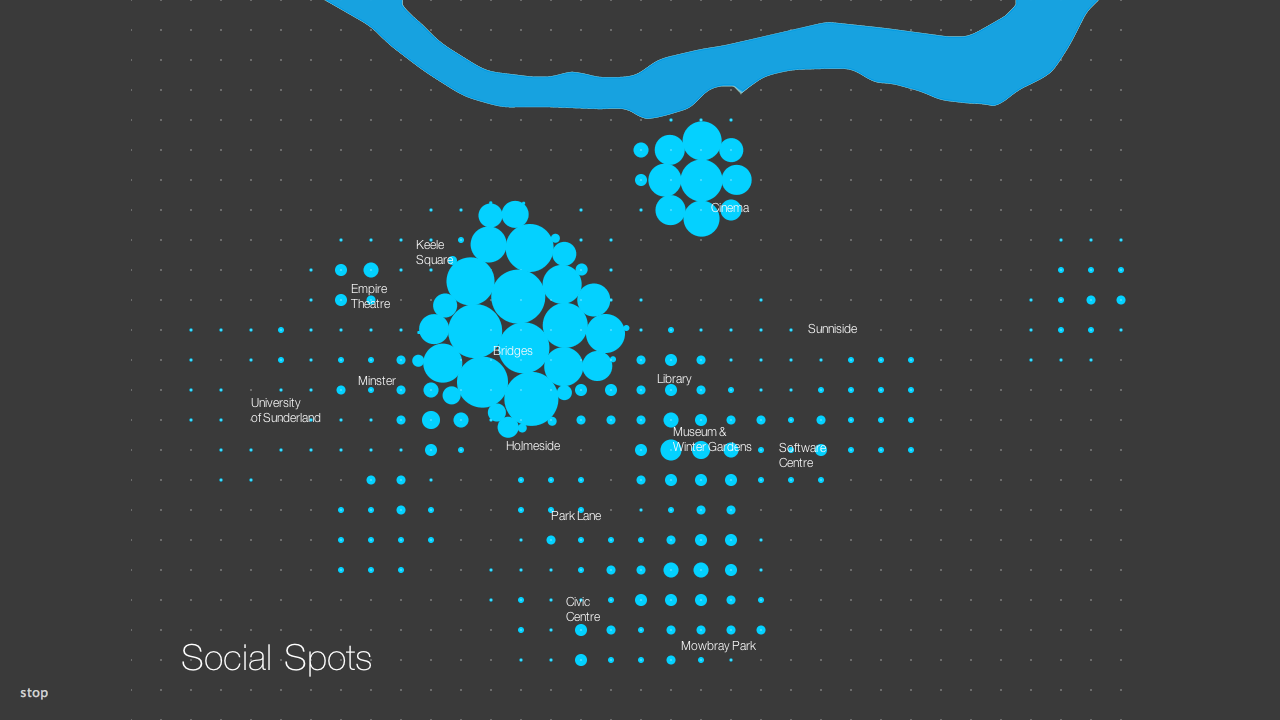
An experimental interactive touch screen was developed as a 'proof of concept' to explore and illustrate way in which users may interact with the data and explore the 'emotional' view of the city via a tangible touch-screen interface
