The project
This experimental visualisation was created for the Chronotopic Cartographies research project. It explores ways of visualizing temporal spaces in fictional literary texts as interactive 3D 'literary landscapes'.
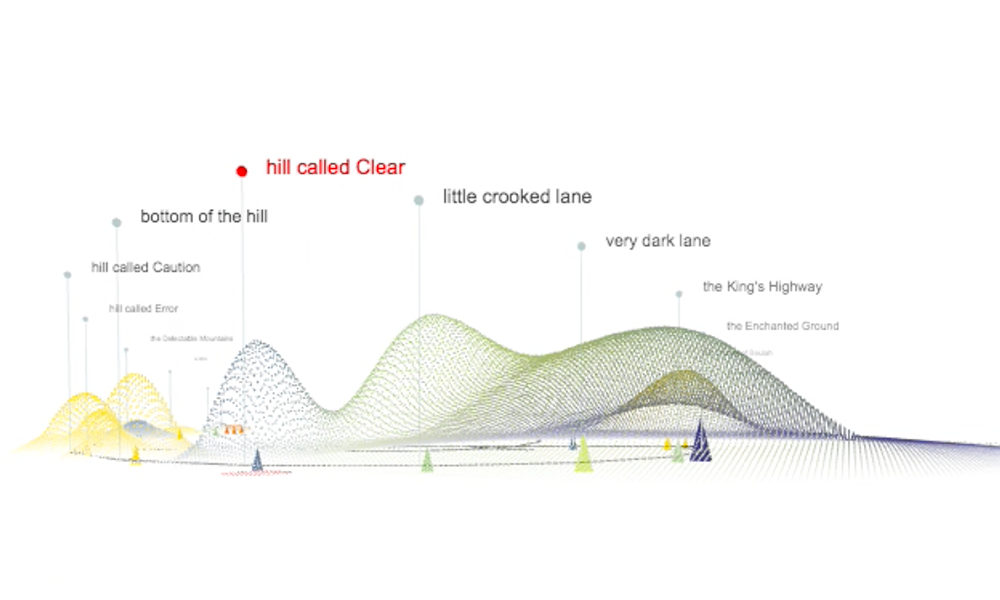
The project uses a series of fictional literary texts as its data source - including War of the Worlds, Pilgrim's Progress and works from C.S. Lewis. The texts are visualized as dynamic 3D 'landscapes'. Hills and peaks emerge over time to indicate prominent spaces within the literary space as the user moves and reads through the narrative.
Terrain Map
Each text has been marked-up using a bespoke XML schema to identify the spaces and places at every point in the narrative. The visualisation translates the base XML into a 3D interactive terrain to reveal the spatial relationships of the places, their significance at each point in the text and the ebb and flow of the narrative as it jumps between them.

.
TimeLine
Users can read through and explore the text via a scrubbable narrative timeline. As they do so, hills and peaks which represent the spaces in the text emerge (and grow) to highlight prominent places at specific points throughout the narrative.
ReadING THE MAPS
Each 3D landscape is a representation of the places in each narrative, illustrating the way the story moves between them. Markers on the ground show the location and name of each place. The size, colour and shape of peaks illustrate the type and signifiance of each space in the text.
Peaks
Each text passage has a 'height' value which is generated by the amount of words in each passage and how close the reader is to the passage in the text. This creates a series of 'peaks' on the map . As the reader moves the through the text, so places that are nearer and significant to text become larger.
Markers
Markers denote the specific position of Topos elements [passages of text]. Each marker represents a single passage of text. Colour is defined by its associated 'Chronotype'. The size is defined by the amount of text in the passage
PLaces
Specific (named) places in the text are visualized as labelled place markers. Groups of passages in the text are clustered around shared places - these are marked and labelled on the map.
NODES
Nodes are chronotopic points. They indicate (represent] the spatial relationships between objects. Nodes provide the 'ground' upon which the map is based. Viewing the map from above will show, more clearly the spatial network of topos nodes.
Navigation
The timeline bar shows the chronological sequence of the passages in each text. The colour of each rectangle corresponds to the chronotype of the passage. The circle indicates the users current point in the novel, and the highlighted section indicates the portion of the narrative which is visible on the map. By sliding the timeline users canmove through the narrative and see siginificant spaces and places on the map emerge.
MOVING THE TIMELINE
Each passage has a 'height' value creating a 'peak' which illustrates its proximity to the readers current point in the narrative. As the reader moves the through the text, so places that are nearer become larger, and the peak increases.
CHANGING THE SPAN
Drag the triangles left and right to expand or contract the narrative section ('span') revealed on the map.
Drag the triangles left and right to expand or contract the narrative section ('span') revealed on the map.
ROTATING
Each has a 'height' value creating a 'peak' which illustrates its proximity to the readers current point in the narrative. As the reader moves the through the text, so places that are nearer become larger, and the peak
ZOOMING AND SCALING
Each passage has a 'height' value creating a 'peak' which illustrates its proximity to the readers current point in the narrative. As the reader moves the through the text, so places that are nearer become larger, and the peak increases.
Chronotopes
A core concept behind the visualisation model is Mikhail Bakhtin’s "chronotope" or time-space for literature. These are represented on the map by colour values
In "Forms of Time and of the Chronotope in the Novel", Mikhail Bakhtin describes various forms of chronotope. Bakhtin’s categories are represented by a list of colour values which to represent different kind of spatio-temporal phases within each text.
The colours used throughout the visualisation correspond to Bakhtin’s range Chronotopes. The chronotope colours used the terrain merge and blend to give an overall impression of the range of predominant chronotypes that are prevalent in each space
